
Fil:Extrapolation example.svg

Size of this PNG preview of this SVG file: 600 × 480 pixels. Andre opløsninger: 300 × 240 pixels | 960 × 768 pixels | 1.280 × 1.024 pixels | 2.560 × 2.048 pixels.
Fuld opløsning (SVG fil, basisstørrelse 600 × 480 pixels, filstørrelse: 10 KB)
|
|
Denne fil er fra Wikimedia Commons. Beskrivelsen af filen fra Commons er gengivet nedenfor. |
Beskrivelse
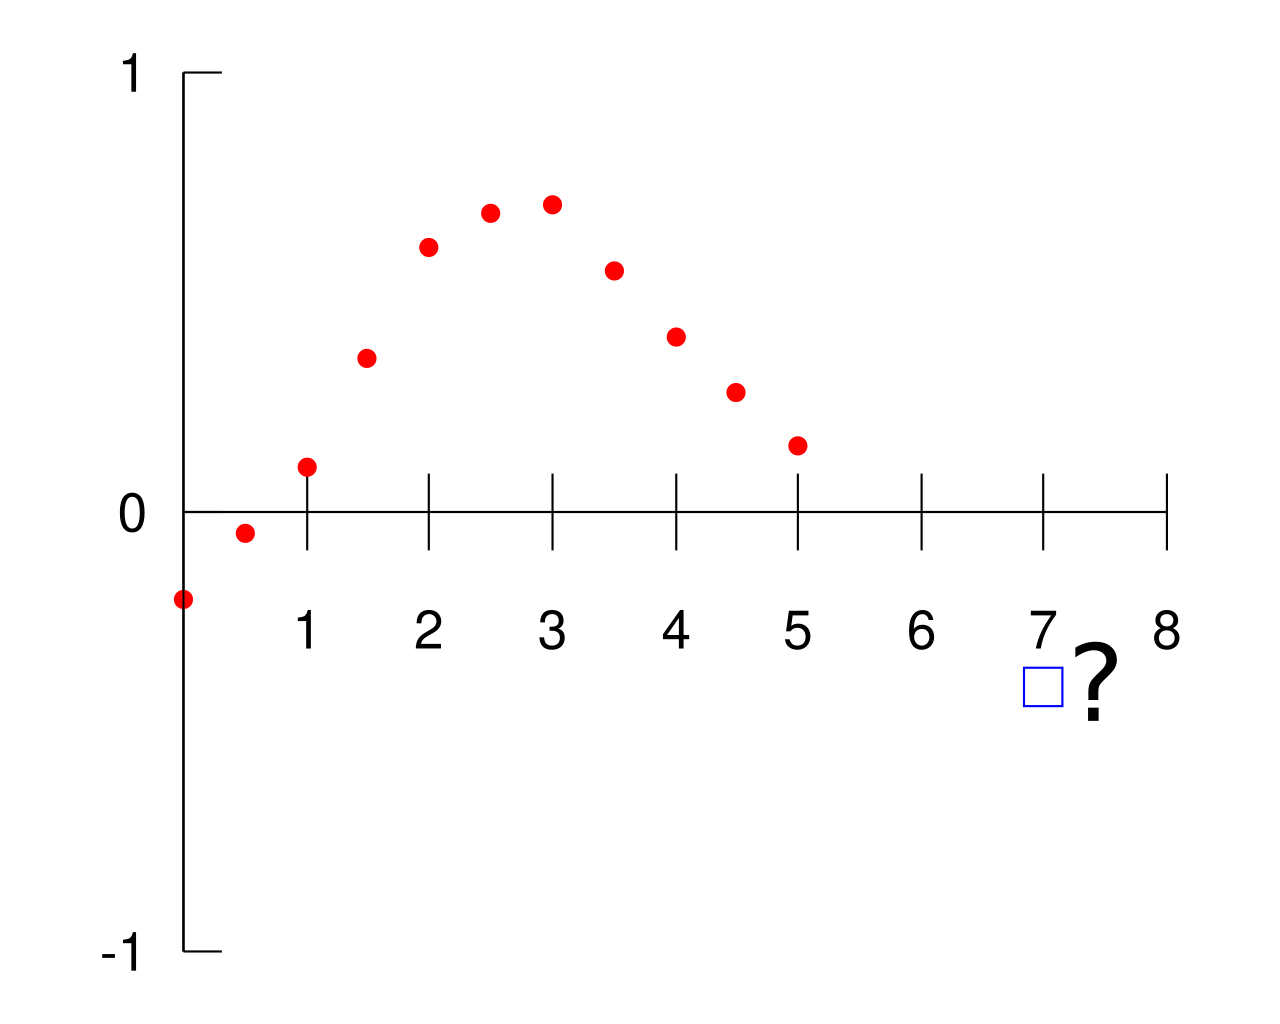
| Beskrivelse | Illustration of Extrapolation. The red points are assumed known and the extrapolation problem consists of giving a meaningful value to the blue box at . |
| Dato | |
| Kilde | self-made in Gnuplot. Question mark added in Inkscape. |
| Forfatter | Berland |

Gnuplot source code
set terminal svg fname "Helvetica" fsize 25
set output "Extrapolation_example.svg"
set key off
set xzeroaxis
set xtics axis 1,1
set ytics nomirror 1
set border 2
set xrange [0:8]
plot "-" with points pointtype 7 pointsize 0.5, 0 with lines -1,\
 "-" with points pointtype 4 pointsize 1
0 -0.2
0.5 -0.05
1 0.1
1.5 0.35
2 0.6
2.5 0.68
3 0.7
3.5 0.55
4 0.4
4.5 0.27
5 0.15
e
7 -0.4
e
Licensering
| Dette værk er blevet udgivet som offentlig ejendom af dets skaber, I, Berland. Dette gælder i hele verden. I nogle lande er dette ikke juridisk muligt. I så fald: I, Berland giver enhver ret til at anvende dette værk til ethvert formål, uden nogen restriktioner, medmindre sådanne restriktioner er påkrævede ved lov. |
set terminal svg fname "Helvetica" fsize 25 set output "Extrapolation_example.svg" set key off set xzeroaxis set xtics axis 1,1 set ytics nomirror 1 set border 2 set xrange [0:8] plot "-" with points pointtype 0 pointsize 0.5, 0 with lines -1,\
"-" with points pointtype 4 pointsize 1
0 2.6680 0.5 2.6975 1 2.7272 1.5 2.7568
Filhistorik
Klik på en dato/tid for at se filen som den så ud på det tidspunkt.
| Dato/tid | Miniaturebillede | Dimensioner | Bruger | Kommentar | |
|---|---|---|---|---|---|
| nuværende | 24. jun. 2007, 17:34 | | 600 × 480 (10 KB) | Berland | {{Information |Description=Illustration of Extrapolation. The red points are assumed known and the extrapolation problem consists of giving a meaningful value to the blue box at <math>x=7</math>. |Source=self-made in Gnuplot. Questio |
Filanvendelse
Den følgende side bruger denne fil:
Global filanvendelse
Følgende andre wikier anvender denne fil:
- Anvendelser på ar.wikipedia.org
- Anvendelser på bg.wikipedia.org
- Anvendelser på bs.wikipedia.org
- Anvendelser på ca.wikipedia.org
- Anvendelser på en.wikipedia.org
- Anvendelser på eo.wikipedia.org
- Anvendelser på es.wikipedia.org
- Anvendelser på fa.wikipedia.org
- Anvendelser på hi.wikipedia.org
- Anvendelser på hr.wikipedia.org
- Anvendelser på id.wikipedia.org
- Anvendelser på ko.wikipedia.org
- Anvendelser på nn.wikipedia.org
- Anvendelser på no.wikipedia.org
- Anvendelser på pl.wikipedia.org
- Anvendelser på pt.wikipedia.org
- Anvendelser på sv.wikipedia.org
- Anvendelser på sv.wikibooks.org
- Anvendelser på sv.wiktionary.org
- Anvendelser på vi.wikipedia.org